Disclaimer and cautionary statement
Read the full Disclaimer and Cautionary Statement.
By accepting you represent that you have read and understood the full Disclaimer and Cautionary Statement.
Highlights
We continue to deliver strong sustainable performance.
Net income attributable to shareholders (NIAS)
USD
3.8
Market capitalization1
CHF
56.2
Proposed gross dividend per share2
CHF
20
Customers interviewed through NPS3
1025000
CO2e emissions per employee4
1.8
Total amount of impact investments5
USD
5.8
Net income attributable to shareholders (NIAS)
USD
3.8 bn
1 Market valuation as of December 31
2 2020 is proposed dividend per share, subject to approval by shareholders at the Annual General Meeting. Gross dividend, subject to 35 percent Swiss withholding tax.
3 In 2020, Zurich interviewed over 1 million customers (including Zurich Santander) in over 25 countries through its Net Promoter System (NPS) program.
4 Number shown as of 2019; 2020 data will be available in Q2 2021.
5 Impact investments in 2020 consisted of: green bonds (USD 3.8 billion), social and sustainability bonds (USD 904 million), investments committed to private equity funds (USD 189 million, thereof 64 percent drawn down) and impact infrastructure private debt (USD 904 million).
What are you interested in?
Story view Download the fullAnnual Report 2020 Download theFinancial Review 2020Leveraging our strengths
We continue to focus on customers, while simplifying our business and driving innovation. Our strengths provide a good basis for our success. We implement our strategy by remaining true to our purpose and values.
Our targets for 2020-2022
We see opportunities to grow the business. We will remain cost-driven and continue to simplify the organization. We aim to improve portfolio quality and make better use of capital.
1 Business operating profit after tax return on equity, excluding unrealized gains and losses.
2 Before capital deployment
3 From FY-20 the basis for the Group’s target capital has been changed to the Swiss Solvency Test (SST). Previously the target was based on the Group’s internal Z-ECM basis.
Dynamic, agile and well balanced
Together with the Group’s customer-focused strategy and simplified operating model, the results position the Group well to take advantage of ongoing changes within the global insurance industry and to deliver further value to shareholders.
Our business segment performance:
Insurance, services and risk insights.
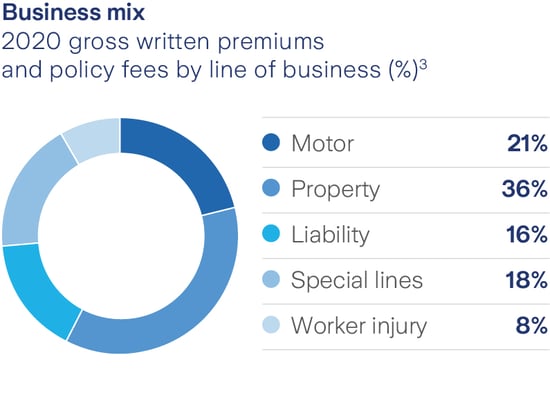
Commercial insurance generates around two-thirds of the Group’s Property & Casualty gross written premiums. Zurich is well placed to benefit from strong pricing trends expected in commercial insurance in 2021, having reshaped its commercial portfolio during 2016-2019.
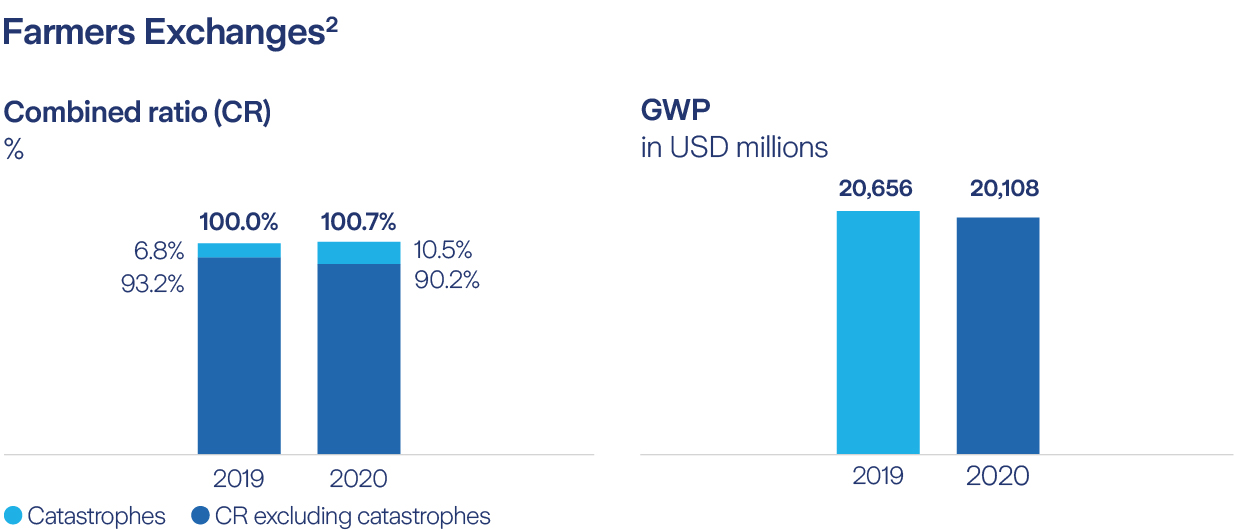
1 Zurich Insurance Group has no ownership interest in the Farmers Exchanges. Farmers Group, Inc., a wholly owned subsidiary of the Group, provides certain non-claims services and ancillary services to the Farmers Exchanges as its attorney-in-fact and receives fees for its services. Details on business mix of the Exchanges are provided for informational purposes only.
2 Based on business operating profit before net expense of group functions and operations and non-core businesses.
3 Percentages may not total 100 due to rounding.
| in USD millions, for the years ended December 31 | 2020 | 2019 | Change1 |
|---|---|---|---|
| Business operating profit | 4,241 | 5,302 | (20%) |
| Net income attributable to shareholders | 3,834 | 4,147 | (8%) |
| P&C business operating profit | 2,080 | 2,878 | (28%) |
| P&C gross written premiums and policy fees | 35,518 | 34,184 | 4% |
| P&C combined ratio | 98.4% | 96.4% | (2.0 pts) |
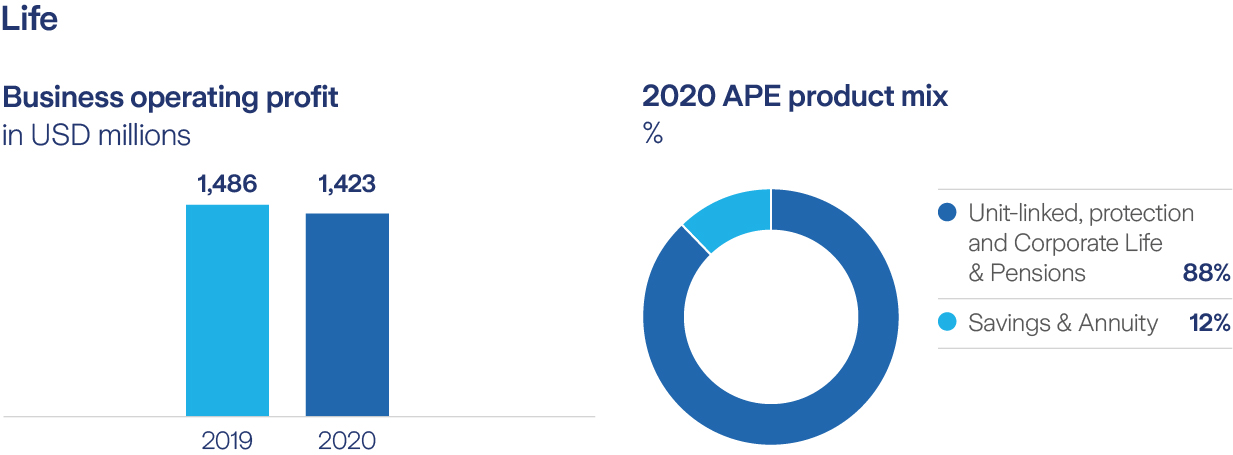
| Life business operating profit | 1,423 | 1,486 | (4%) |
| Life gross written premiums, policy fees and insurance deposit | 27,616 | 33,479 | (18%) |
| Life new business annual premium equivalent (APE)2 | 3,625 | 4,331 | (16%) |
| Life new business margin, after tax (as % of APE)2 | 25.1% | 25.8% | (0.8 pts) |
| Life new business value, after tax2 | 788 | 976 | (19%) |
| Farmers business operating profit | 1,501 | 1,707 | (12%) |
| Farmers Management Services management fees and other related revenues | 3,703 | 3,780 | (2%) |
| Farmers Management Services managed gross earned premium margin | 6.8% | 7.0% | (0.2 pts) |
| Farmers Life new business annual premium equivalent (APE)2 | 75 | 82 | (9%) |
| Average Group investments3 | 204,639 | 190,237 | 8% |
| Net investment result on Group investments3 | 6,950 | 7,391 | (6%) |
| Net investment return on Group investments3,4 | 3.4% | 3.9% | (0.5 pts) |
| Total return on Group investments3,4 | 6.4% | 8.2% | (1.9 pts) |
| Shareholders’ equity | 38,278 | 35,004 | 9% |
| Swiss Solvency Test ratio5 | 182% | 222% | (40.0 pts) |
| Return on common shareholders’ equity (ROE)6 | 13.0% | 14.4% | (1.3 pts) |
|
Business operating profit (after tax) return on common shareholders’ equity (BOPAT ROE)6 |
11.0% | 14.2% | (3.3 pts) |
1 Parentheses around numbers represent an adverse variance.
2 Details of the principles for calculating new business are included in the embedded value report in 2019. New business value and new business margin are calculated after the effect of non-controlling interests, whereas APE is presented before non-controlling interests.
3 Including investment cash.
4 Calculated on average Group investments.
5 Estimated Swiss Solvency Test (SST) ratio as of January 1, 2021, has been calculated based on the Group’s Internal Model, which has been approved by the Swiss Financial Market Supervisory Authority FINMA. The SST ratio as of January 1 has to be filed with FINMA by end of April each year and is subject to review by FINMA. FINMA agreed to the use of standard yield curves for the main currencies to calculate the SST, starting end of Q1 2020. The ratio as of January 1, 2020 has been re-calculated on the same basis for disclosure purposes in order to allow better comparison.
6 Shareholders’ equity used to determine ROE and BOPAT ROE is adjusted for net unrealized gains/(losses) on available-for-sale investments and cash flow hedges.
Strong Results
Full-year 2020 results demonstrated a strong performance in a challenging environment. We reported business operating profit (BOP) of USD 4.2 billion compared with USD 5.3 billion in 2019. The decline was largely due to the impact of COVID-19 and higher catastrophe losses. Net income attributable to shareholders amounted to USD 3.8 billion and a dividend of CHF 20 has been proposed.
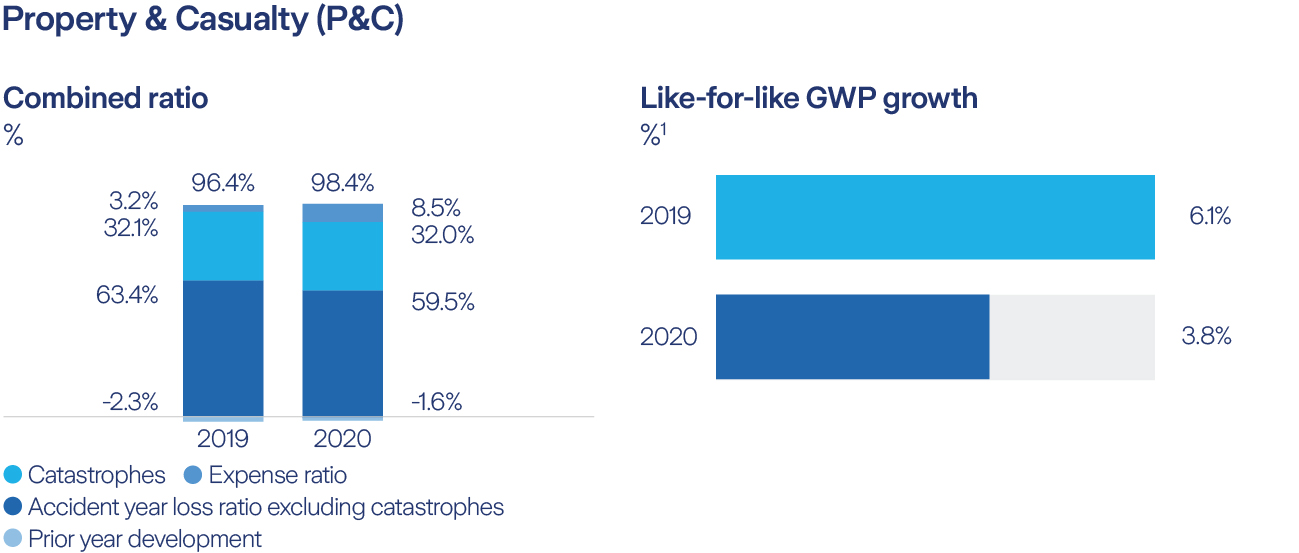
1 In local currency and adjusted for closed acquisitions and disposals.
2 Provided for informational purposes only. Zurich Insurance Group has no ownership interest in the Farmers Exchanges. Farmers Group, Inc., a wholly owned subsidiary of the Group, provides certain non-claims services and ancillary services to the Farmers Exchanges as its attorney-in-fact and receives fees for its services.

“Together with our customer focused strategy, simplified operating model and strong balance sheet, the Group is positioned for further growth.”
George Quinn
Group Chief Financial Officer
Consistent execution pays off
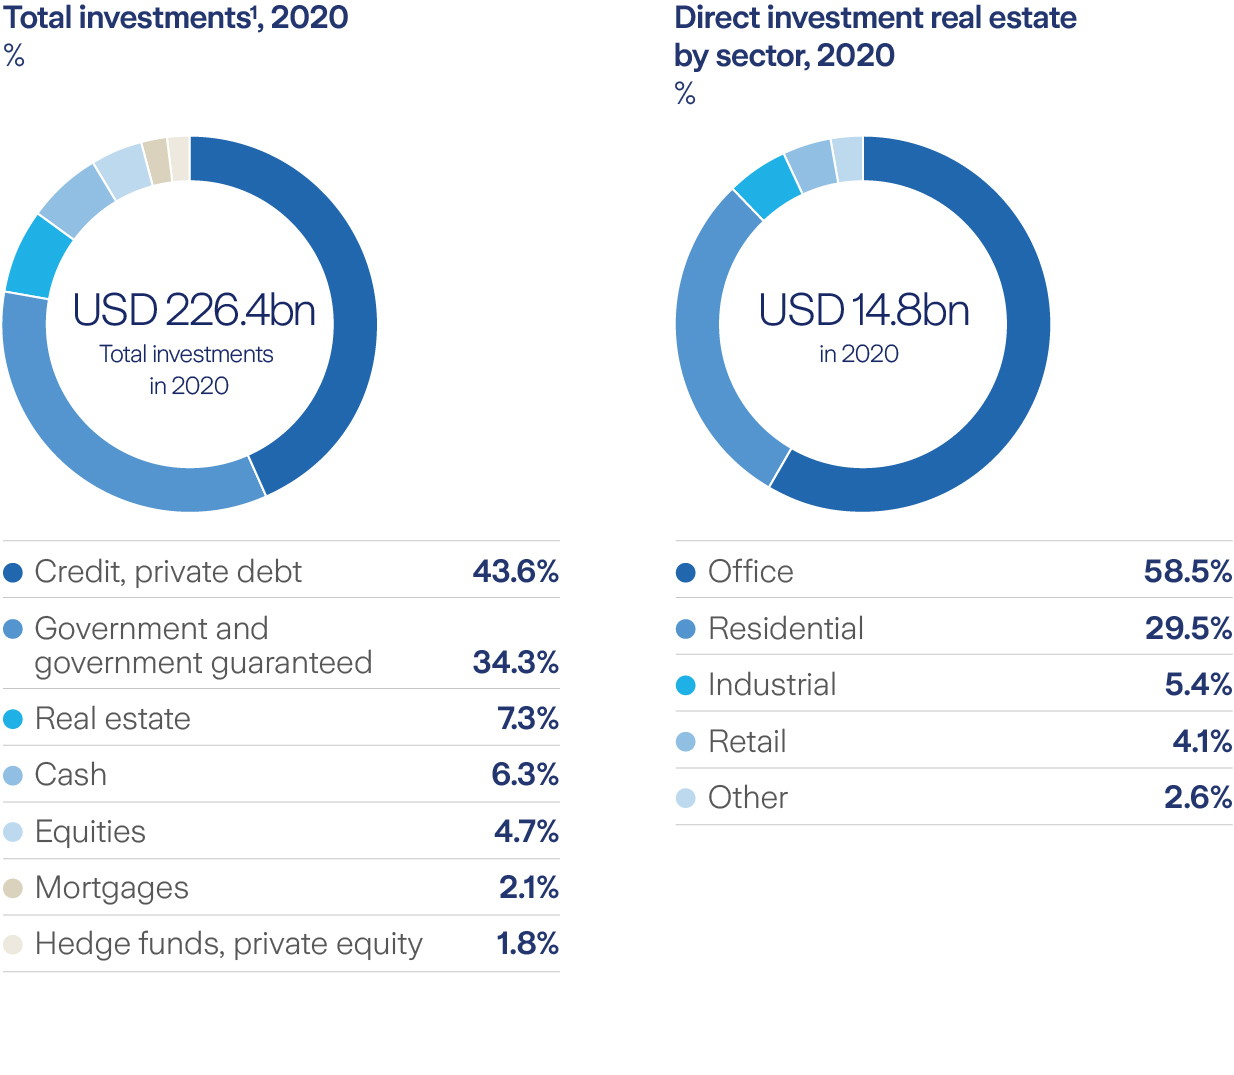
Our net investment income decreased by 7 percent to USD 4.9 billion while net capital gains remained broadly flat compared to prior year, at USD 2.0bn. In the third quarter, we exceeded our USD 5 billion target for impact investments aimed at prioritizing environmental and social goals, and by the end of the year our impact portfolio reached an impressive USD 5.8 billion. Overall, our full-year total investment return reached 6.4 percent, a strong performance given the unprecedented market developments throughout the year.
1 Market value of the investment portfolio (economic view).

“Our portfolios proved to be resilient in times of market stress and delivered a solid investment performance.”
Urban Angehrn
Group Chief Investment Officer
As an insurer, we have a key role to play in supporting customers, employees, investors, communities, and the planet we share, by building resilience and serving their needs.

The Path to sustainability
During an unprecedented year of social and economic disruption, we have demonstrated our commitment to supporting a sustainable future. Zurich is proud to make a difference to the lives and the futures of our stakeholders. Our non-financial measures below provide more insight:
| 2020 | 2019 | Change | |
|---|---|---|---|
| Number of customers interviewed through Zurich’s NPS program1 | 1,025,000 | 1,047,000 | (2%) |
| Number of close the loop feedback calls | 73,000 | 72,000 | 1% |
1 In 2020, Zurich interviewed over one million customers (including Zurich Santander) in 25 countries through its Net Promoter System (NPS) program.
Our global Net Promoter System (NPS) program provides us with insights on how to attract new customers – as well as retain existing ones – by creating excellent customer experiences. Ultimately, the aim is to increase the share of promoters we have among our customers. We measure NPS by sending surveys to our customers across 25 countries and are now covering 90 percent of our business (in revenue terms). We always close the loop with our detractors – a process in which all of our executives are also involved.
| 2020 | 2019 | Change | |
|---|---|---|---|
| Total number of employees – headcount | 55,089 | 55,369 | (1%) |
| Total number of employees – FTE (full time equivalents) | 52,930 | 54,030 | (2%) |
| Employee turnover rate1 | 9.6% | 13.6% | (4.0 pts) |
| Average tenure (years) | 10 | 10 | n.m. |
| Group voluntary turnover1 | 4.7% | 7.2% | (2.5 pts) |
| Technical functions voluntary turnover1, 2 | 4.6% | 6.5% | (1.9 pts) |
| Female workforce participation | 51.0% | 51.1% | 0 pts |
| Female participation in Leadership Team | 27.1% | 22.6% | 4.5 pts |
| Employee participation in Group-wide feedback channels3 | 84.0% | 76.0% | 8.0 pts |
| Employee net promoter score (ENPS)4 | +52 | +26 | 26 |
Notes: Bolivia and the Farmers Exchanges are not in scope of any above key performance indicators (KPIs). The Farmers Exchanges are owned by their policyholders. Farmers Group, Inc., a wholly owned subsidiary of the Zurich Insurance Group, provides certain non-claims services and ancillary services to the Farmers Exchanges as attorney-in-fact and receives fees for its services.
1Turnover figures only consider regular and inpatriate employees.
2Technical functions include Claims, Underwriting and Risk Engineering.
3 Group-wide feedback channels include organization health surveys, employee net promoter scores (ENPS) and any other Group-wide feedback channels. This KPI refers to the average participation rate in the two occurrences of the employee net promoter score survey in 2019, while in 2020 it refers to the single survey that was carried out due to the pandemic.
4 ENPS is calculated as the average of the two surveys carried out during the year in 2019, and based on the single survey for 2020, measuring employee loyalty through the likelihood to recommend the company as a place to work. ENPS is based on the methodology of measuring and improving customer satisfaction and loyalty (transaction NPS and relationship NPS) which Zurich uses as a successful method to retain customers.
| 2020 | 2019 | Change | |
|---|---|---|---|
| Fundraising and donations (USD millions)1 | 3 | 2 | 10% |
| Total time volunteered by workforce (business hours)2 | 38,830 | 129,702 | (70%) |
| of which skills-based hours2 | 19,485 | 31,463 | (38%) |
| Workforce actively volunteering (% of total headcount)2 | 9.3% | 20.9% | (11.6 pts) |
| Total full year charitable cash contributions by Zurich business units (USD millions)3 | 32 | 12 | 168% |
| Total full year charitable cash contributions by Zurich to Z Zurich Foundation (USD millions)4 |
43 | 40 | 6% |
Notes: Zurich Insurance Group and its employees are contributing through fundraising, volunteering and cash contributions apart from the community investment activities carried out by the Z Zurich Foundation. All figures exclude Farmers Exchanges. Zurich Insurance Group has no ownership interest in the Farmers Exchanges. Farmers Group, Inc., a wholly owned subsidiary of the Group, provides certain non-claims services and ancillary services to the Farmers Exchanges as attorney-in-fact and receives fees for its services.
1 Mostly includes Zurich employees’ fundraising and donations. As the share of the Zurich business units’ matching becomes negligible, the split of these two sub-categories is no longer reflected.
2 2019 figures have been restated to exclude volunteering by Farmers Exchanges employees.
3 The increase in cash contributions in 2020 is mainly driven by a one-off donation to the COVID-19 Support Fund in UK.
4 Starting from 2019, contributions cover the total charitable donations made by various legal entities of the Zurich Insurance Group to the Z Zurich Foundation on a cash-out basis. The donation amounted to CHF 40 million in 2019 and 2020.
| 2020 | 2019 | Change | |
|---|---|---|---|
| External asset managers who are signatories to PRI (%)1 | 81.8% | 81.3% | 0.6 pts |
| Group assets managed by PRI signatories (%)2 | 97.5% | 97.5% | 0.1 pts |
| Total amount of impact investments (USD millions)3 | 5,770 | 4,555 | 27% |
| Investment portfolio (USD millions)4 | 226,389 | 204,803 | 11% |
1 The United Nations-supported Principles for Responsible Investment (PRI).
2 Including assets managed by Zurich.
3 Impact investments in 2020 consisted of: green bonds (USD 3.8 billion), social and sustainability bonds (USD 904 million), investments committed to private equity funds (USD 189 million, thereof 64 percent drawn down) and impact infrastructure private debt (USD 904 million).
4 The investment portfolio is calculated on a market basis, and is different from the total Group investments reported in the consolidated financial statements, which is calculated on an accounting basis and doesn’t include cash and cash equivalents.
| 2019 | 2018 | Change | |
|---|---|---|---|
| Impact of real estate investment: Energy consumption (kWh per sqm)1, 2 | 108 | 113 | (5%) |
| Impact of real estate investment: CO2e emissions (kg per sqm)1, 2 | 25.5 | 27 | (6%) |
| Own operations: CO2e emissions per employee (metric tons per FTE)2, 3 | 1.8 | 1.9 | (10%) |
1 Scope includes real estate investments in Switzerland (40 percent of global direct real estate investment value). Buildings in the real estate investment portfolio are largely not used by Zurich. The data are based on meter readings and energy supplier information and are heating degree adjusted.
2 CO2e emissions per employee data 2020 will be available in Q2 2021, and Impact of real estate investment data 2020 will be available in Q1 2022.
3 Includes emissions from own-use real estate (electricity and heat), from air travel, rail and cars (rental cars and car fleet).
Total tax contributions1 20192
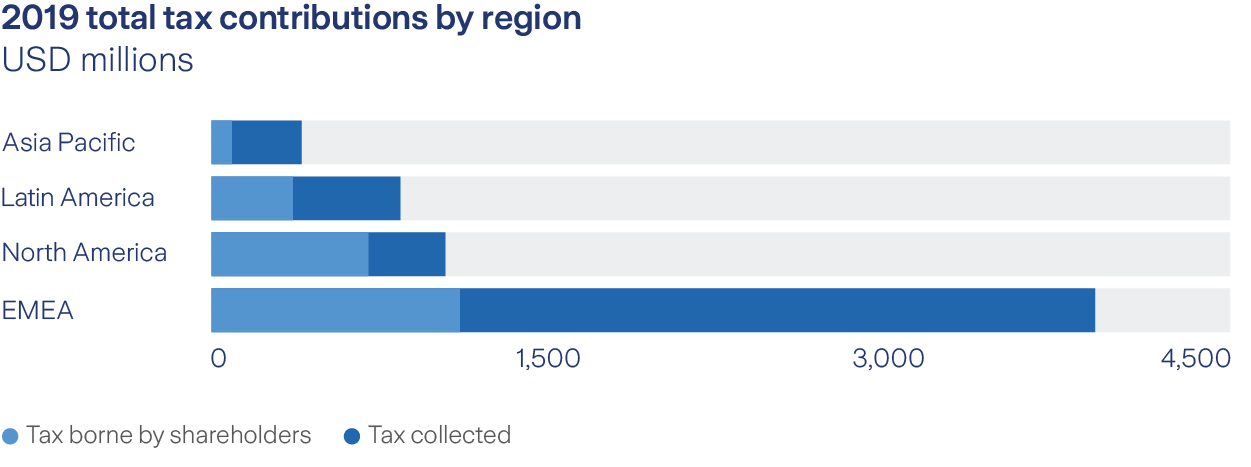
1 Numbers based on IFRS excluding deferred income tax.
2 Tax contributions for 2020 will be available in Q2 2021.
Top 20 countries with the highest total tax contribution1 in 2019
| Country | |||
| (in USD millions) | Total tax contribution | Tax collected | Tax borne by shareholders |
| U.S. | 1,678 | 997 | 680 |
| Switzerland | 1,615 | 1,190 | 425 |
| UK | 923 | 794 | 129 |
| Germany | 827 | 657 | 170 |
| Italy | 517 | 380 | 137 |
| Brazil | 507 | 317 | 190 |
| Spain | 366 | 252 | 114 |
| Australia | 332 | 319 | 14 |
| Mexico | 309 | 246 | 63 |
| Austria | 304 | 277 | 27 |
| Ireland | 240 | 204 | 37 |
| Argentina | 220 | 168 | 52 |
| Chile | 118 | 75 | 43 |
| Portugal | 91 | 59 | 32 |
| Japan | 72 | 26 | 46 |
| France | 45 | 40 | 5 |
| Malaysia | 45 | 27 | 18 |
| Canada | 42 | 38 | 4 |
| Ecuador | 30 | 26 | 4 |
| Netherlands | 25 | 22 | 3 |
1 These countries contribute to more than 96% of Zurich’s revenue.
The balance between ‘total tax collected’ and ‘tax borne by shareholders’ varies between regions and countries due to Zurich’s local footprint but also due to different characteristics of the various tax jurisdictions in which Zurich operates.

Read more about our stories from the year
Downloads
| Full Annual Report | (16.5 MB/PDF) |
| Group overview | (9.2 MB/PDF) |
| Governance | (4.7 MB/PDF) |
| Risk review | (556 KB/PDF) |
| Non-financial statements (incl. GRI index) | (511 KB/PDF) |
| Financial review | (1.7 MB/PDF) |