Highlights
We continue to deliver strong sustainable performance.
Explore to see details
Net income attributable to shareholders (NIAS)1
USD
1,7 bn
Market capitalization2
CHF
24,8 bn
Proposed gross dividend per share3
CHF
8
Customers interviewed through NPS4
162'796
CO2e emissions per employee5
0,8 tons
Total amount of impact investments6
USD
1,9 bn
1 Net income attributable to shareholders (NIAS)
2 Market valuation as of December 31
3 Gross dividend, subject to 35 percent Swiss withholding tax. 2019 is proposed dividend subject to approval by shareholders at the Annual General meeting.
4 In 2019, Zurich interviewed over 1 million customers (including Zurich Santander) in 25 countries through its NPS (Net Promoter System) program.
5 Number shown as of 2018; 2019 data will be available in Q2 2020.
6 Impact investments in 2019 consisted of: green bonds (USD 3.1 billion), social and sustainability bonds (USD 539 million), and investments committed to private equity funds (USD 163 million, thereof 36 percent drawn down) and impact infrastructure private debt (USD 747 million).
What are you interested in?
Story view Download the full Annual Report 2019 Download the financial review 2019Our strategy is successful
We continue to focus on customers, while simplifying our business and driving innovation. Our strengths provide a good basis for our success. We implement our strategy by remaining true to our purpose and values.

Focus on customers
Our transformation to become a truly customer-led company is well underway and we have established a platform from which to evolve and grow.

Simplify
We have successfully simplified our business and operations, to make better use of our resources.

Innovate
We are adapting to make sure we continue to meet and exceed customers’ expectations and needs.
How we delivered on our 2017-2019 targets
2017 - 2019 targets:
BOPAT ROE1
Z-ECM
Net cash remittances
USD
>4,0 bn (cumulative)Net savings
USD
0,6 bn by 2019 compared with 2015 baselineAchieved:

BOPAT ROE
Z-ECM2
Net cash remittances
USD
4,5 bn
Net savings
USD
0,7 bnWe improved our business mix, reduced volatility and improved profitability of our Property & Casualty portfolios while further growing our Life franchise through targeted acquisitions. We entered new and innovative markets and succeeded in reducing expenses. Our management structure has been strengthened and reinforced. And customer and employee satisfaction has improved. Farmers Exchanges has transformed its agents force and expanded its solutions for millennials.
Our targets for 2020-2022
2020 - 2022 targets:
BOPAT ROE1
Z-ECM
Net cash remittances
USD
>4,8 bn (cumulative)Compound organic earnings per share growth3
at least
2% per annumWe see opportunities to grow the business. We know which type of growth we want to achieve. We will remain cost-driven and continue to simplify the organization. We aim to improve portfolio quality and make better use of capital. To sharpen our focus on customers, we are also adding two new KPIs.
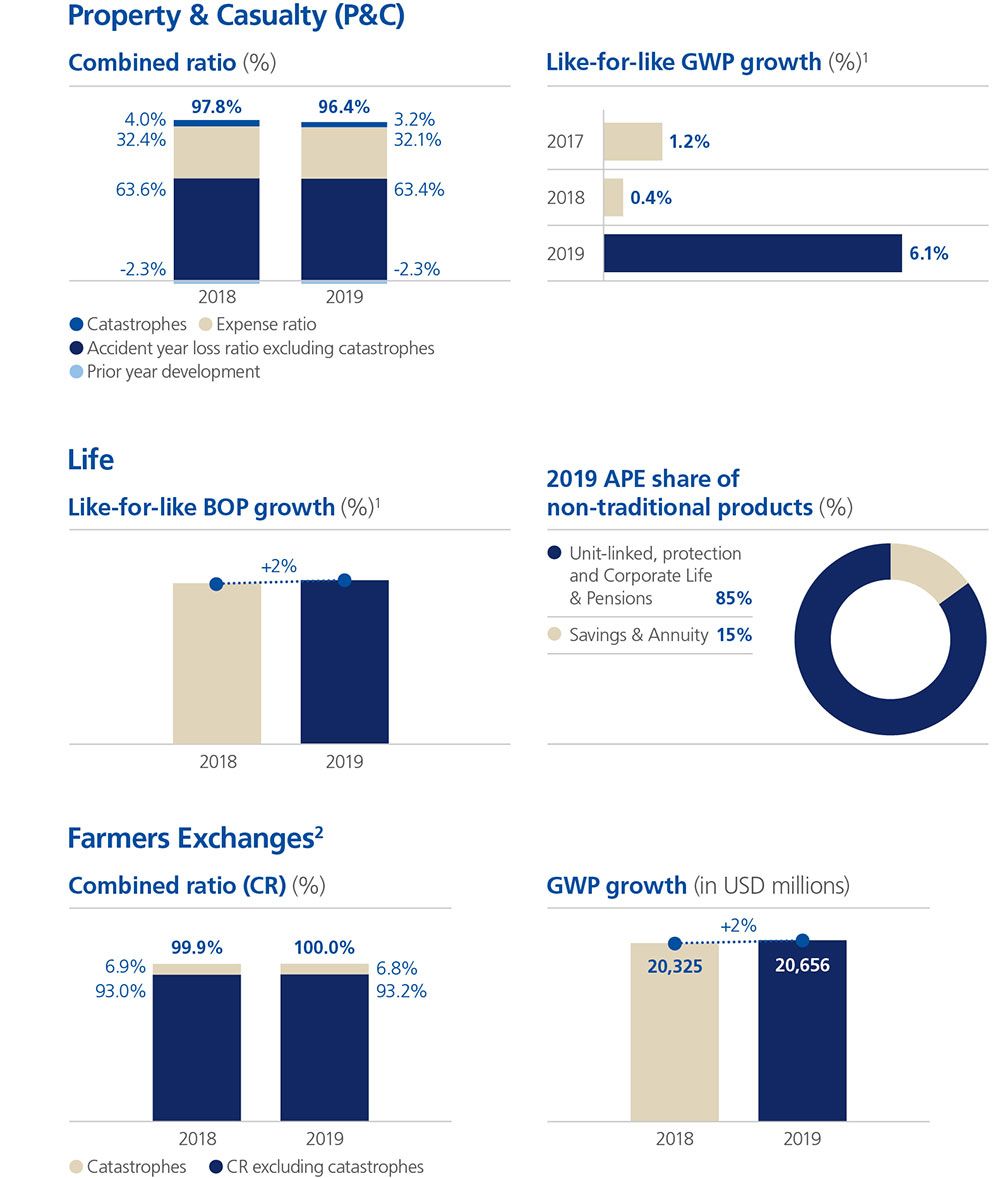
Our strategic focus has enabled us to deliver a strong performance across our business
Together with the Group’s customer-focused strategy and simplified operating model, the results position the Group well to take advantage of ongoing changes within the global insurance industry and to deliver further value to shareholders.
Our business segment performance:
Business operating profit
USD
1,2 bnGross written premiums and policy fee
USD
14,3 bn| in USD millions, for the years ended December 31 | 2019 | 2018 | Change1 |
| Business operating profit | 5,302 | 4,566 | 16% |
| Net income attributable to shareholders | 4,147 | 3,716 | 12% |
| P&C business operating profit | 2,878 | 2,085 | 38% |
| P&C gross written premiums and policy fees | 34,184 | 33,505 | 2% |
| P&C combined ratio | 96.4% | 97.8% | 1.4 pts |
| Life business operating profit | 1,486 | 1,554 | (4%) |
| Life gross written premiums, policy fees and insurance deposit | 33,479 | 33,448 | 0% |
| Life new business annual premium equivalent (APE)2 | 4,331 | 4,639 | (7%) |
| Life new business margin, after tax (as % of APE)2 | 25.8% | 24.1% | 1.8 pts |
| Life new business value, after tax2 | 976 | 981 | (1%) |
| Farmers business operating profit | 1,707 | 1,643 | 4% |
| Farmers Management Services management fees and other related revenues | 3,780 | 3,204 | 18% |
| Farmers Management Services managed gross earned premium margin | 7.0% | 7.0% | (0.0 pts) |
| Farmers Life new business annual premium equivalent (APE)2 | 82 | 84 | (3%) |
| Average Group investments3 | 190,237 | 190,235 | 0% |
| Net investment result on Group investments3 | 7,391 | 6,288 | 18% |
| Net investment return on Group investments3,4 | 3.9% | 3.3% | 0.6 pts |
| Total return on Group investments3,4 | 8.2% | 0.6% | 7.6 pts |
| Shareholders’ equity | 35,004 | 30,189 | 16% |
| Z-ECM5 | 129% | 124% | 5 pts |
| Return on common shareholders’ equity (ROE)6 | 14.4% | 13.1% | 1.3 pts |
|
Business operating profit (after tax) return on common shareholders’ equity (BOPAT ROE)6 |
14.2% | 12.1% | 2.2 pts |
Note: All amounts in the consolidated financial statements, unless otherwise stated, are shown in U.S. dollars, rounded to the nearest million with the consequence that the rounded amounts may not add to the rounded total in all cases. All ratios and variances are calculated using the underlying amounts rather than the rounded amounts.
1 Parentheses around numbers represent an adverse variance.
2 Details of the principles for calculating new business are included in the embedded value report in 2019. New business value and new business margin are calculated after the effect of non-controlling interests, whereas APE is presented before non-controlling interests.
3 Including investment cash.
4 Calculated on average Group investments.
5 Ratio for December 31, 2019 reflects midpoint estimate with an error margin of +/- 5 pts.
6 Shareholders’ equity used to determine ROE and BOPAT ROE is adjusted for net unrealized gains/(losses) on available-for-sale investments and cash flow hedges.
All targets exceeded
Full year 2019 results show strong performance across all businesses, with business operating profit (BOP) up 16 percent and a BOPAT ROE of 14.2 percent. Net income increased 12 percent to the highest level in a decade. A dividend increase of 5 percent has been proposed.
1 In local currency and adjusted for closed acquisitions and disposals.
2 Provided for informational purposes only. Zurich Insurance Group has no ownership interest in the Farmers Exchanges. Farmers Group, Inc., a wholly owned subsidiary of the Group, provides certain non-claims services and ancillary services to the Farmers Exchanges as its attorney-in-fact and receives fees for its services.

"The results show the Group making
further strong progress. All 2017 to 2019
targets were exceeded, with all business
units contributing. Together with our
customer-focused strategy, a simplified
operating model and strong balance
sheet, these results position us well for
the future."
George Quinn
Group Chief Financial Officer
Strong performance across asset classes supports investment return
Solid net investment income of USD 5.3 billion and exceptional total investment return of 8.2 percent contributed strongly to Group financial performance in 2019.


"We continue delivering attractive returns while maintaining discipline and focusing on the quality of our investment portfolios."
Urban Angehrn
Group Chief Investment Officer
We also continue to build on our commitment towards a sustainable future
Zurich is proud to make a difference in the lives and futures of our customers, employees, investors and communities. Our non-financial measures below provide more insight:
| 2019 | 2018 | Change | |
| Number of customers interviewed through Zurich’s NPS program1 | 1,047,000 | 763,000 | 37% |
| Number of close the loop feedback calls | 72,000 | 52,000 | 38% |
1 In 2019, Zurich interviewed over one million customers (including Zurich Santander) in 25 countries through its NPS (Net Promoter System) program.
Our global net promoter system (NPS) program provides us with insights on how to grow and retain existing as well as attract new customers by creating excellent customer experiences. Ultimately the aim is to increase the share of promoters we have among our customers. We measure NPS by sending surveys to our customers across 25 countries and are now covering 90 percent of our business (in revenue terms). We always close the loop with our detractors, a process in which all of our executives are also involved.
| 2019 | 2018 | Change | |
| Total number of employees – headcount | 55,369 | 53,535 | 3% |
| Total number of employees – FTE (full time equivalents) | 54,030 | 52,267 | 3% |
| Employee turnover rate1 | 13.6% | 14.1% | (0.5 pts) |
| Average tenure (years) | 10 | 10 | n.m. |
| Group voluntary turnover1 | 7.2% | 7.5% | (0.3 pts) |
| Technical functions voluntary turnover1, 2 | 6.5% | 7.0% | (0.5 pts) |
| Female workforce participation | 51.1% | 50.7% | 0.4 pts |
| Female participation in Leadership Team | 22.6% | 22.3% | 0.3 pts |
| Employee participation in Group-wide feedback channels3 | 76.0% | 70.0% | 6.0 pts |
| Employee net promoter score (ENPS)4 | +26 | +7 | 19.0 pts |
Notes: For 2019, the heading of this section was changed to ‘people indicators’ to better reflect the content. The ‘active learners’ key performance indicator is not reported for 2019 due to a change in reporting systems. Bolivia and the Farmers Exchanges are not in scope of any above key performance indicators (KPIs). The Farmers Exchanges are owned by their policyholders. Farmers Group, Inc., a wholly owned subsidiary of the Zurich Insurance Group, provides certain non-claims services and ancillary services to the Farmers Exchanges as attorney-in-fact and receives fees for its services.
1 Turnover figures only consider regular and inpatriate employees.
2 Technical functions include Claims, Underwriting and Risk Engineering.
3 Group-wide feedback channels include organization health surveys, employee net promoter scores (ENPS) and any other Group-wide feedback channels. This KPI refers to the average participation rate in the two occurrences of the employee net promoter score survey.
4 ENPS is calculated as the average of the two surveys carried out during the year, measuring employee loyalty through the likelihood to recommend the company as a place to work. ENPS is based on the methodology of measuring and improving customer satisfaction and loyalty (transaction NPS and relationship NPS) which Zurich uses as a successful method to retain customers.
| 2019 | 2018 | Change | |
| Fundraising and donations (USD millions) | 2 | 2 | n.m. |
| of which from Zurich employees (USD millions) | 1 | 1 | n.m. |
| of which matching by Zurich business units (USD millions)1 | 1 | 1 | n.m. |
| Total time volunteered by workforce (business hours) | 142,200 | 121,290 | 17% |
| of which skills-based hours | 31,807 | 29,619 | 7% |
| Workforce actively volunteering (% of total headcount)2 | 20.3% | n/a | n/a |
| Total full year charitable cash contributions by Zurich business units (USD millions)1, 3 | 12 | 10 | 18% |
| Total full year charitable cash contributions by Zurich to Z Zurich Foundation (USD millions)4 |
40 | – | n/a |
Notes: Zurich Insurance Group and its employees are contributing through fundraising, volunteering and cash contributions apart from the community investment activities carried out by the Z Zurich Foundation.
1 Excluded are corporate donations made by the Farmers Exchanges. Zurich Insurance Group has no ownership interest in the Farmers Exchanges. Farmers Group, Inc., a wholly owned subsidiary of the Group, provides certain non-claims services and ancillary services to the Farmers Exchanges as attorney-in-fact and receives fees for its services.
2 In 2019, we reinstated our KPI for measuring the number of unique Zurich employees who participated in one or more volunteering events throughout the year.
3 This includes the matching by Zurich business units amount in the fundraising and donations.
4 Previously, charitable contributions of the Z Zurich Foundation were valued on a cash-out basis for the purposes of the key performance indicators. Starting from 2019, contributions cover the total charitable donations made by various legal entities of the Zurich Insurance Group to the Z Zurich Foundation on a cash-out basis. The previously reported 2018 figures have been restated based on that new approach.
| 2019 | 2018 | Change | |
| External asset managers who are signatories to PRI (%)1 | 81.3% | 74.2% | 7.1 pts |
| Group assets managed by PRI signatories (%)2 | 97.5% | 97.2% | 0.3 pts |
| Total amount of impact investments (USD millions)3 | 4,555 | 3,790 | 20% |
| Investment portfolio (USD millions)4 | 204,803 | 195,472 | 5% |
1 The United-Nations supported Principles for Responsible Investment (PRI).
2 Including assets managed by Zurich.
3 Impact investments in 2019 consisted of: green bonds (USD 3.1 billion), social and sustainability bonds (USD 539 million), investments committed to private equity funds (USD 163 million, thereof 36 percent drawn down) and impact infrastructure private debt (USD 747 million).
4 The investment portfolio is calculated on a market basis, and is different from the total Group investments reported in the consolidated financial statements, which is calculated on an accounting basis and doesn’t include cash and cash equivalents.
| 2018 | 2017 | Change | |
| Impact of real estate investment: Energy consumption (kWh per sqm)1, 2 | 113 | 114 | (1%) |
| Impact of real estate investment: CO2e emissions (kg per sqm)1, 2 | 27 | 28 | (4%) |
| Own operations: CO2e emissions per employee (metric tons per FTE)2, 3 | 1.9 | 2.1 | (6%) |
1 Scope includes real estate investments in Switzerland (40 percent of global direct real estate investment value). Buildings in the real estate investment portfolio are largely not used by Zurich. The data are based on meter readings and energy supplier information and are heating degree adjusted.
2 CO2e emissions per employee data 2019 will be available in Q2 2020, and Impact of real estate investment data 2019 will be available in Q1 2021.
3 Includes emissions from own-use real estate (electricity and heat), from air travel, rail and cars (rental cars and car fleet).
Total tax contributions1 20182
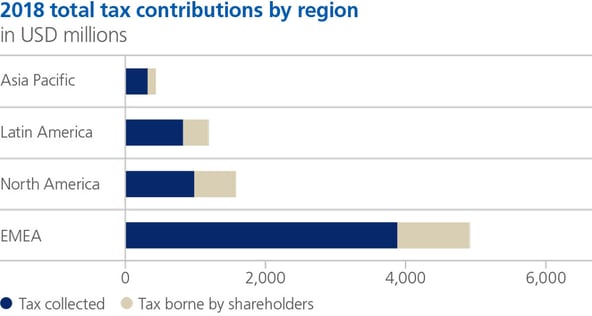
1 Numbers based on IFRS excluding deferred income tax.
2 Tax contributions for 2019 will be available in Q2 2020.
Top 10 countries with the highest total tax contribution in 2018
| Country | |||
| (in USD millions) | Total tax contribution | Tax collected | Tax borne by shareholders |
| U.S. | 1,546 | 954 | 592 |
| Switzerland | 1,372 | 1,076 | 295 |
| Germany | 1,086 | 855 | 231 |
| UK | 848 | 693 | 155 |
| Brazil | 513 | 330 | 183 |
| Italy | 452 | 379 | 73 |
| Spain | 382 | 234 | 148 |
| Austria | 315 | 290 | 25 |
| Argentina | 305 | 223 | 82 |
| Australia | 294 | 242 | 52 |
The balance between ‘total tax collected’ and ‘tax borne by shareholders’ varies between regions and countries due to Zurich’s local footprint but also due to different characteristics of the various tax jurisdictions where Zurich operates.

Read more about our stories from the year
Downloads
| Full Annual Report | (8.8 MB/PDF) |
| Group overview | (3.8 MB/PDF) |
| Consolidated non-financial statements (incl. GRI index) | (171 KB/PDF) |
| Governance | (2.6 MB/PDF) |
| Risk review | (709 KB/PDF) |
| Financial review | (1.7 MB/PDF) |
1 Business operating profit after tax return on equity, excluding unrealized gains and losses.
2 Full year 2019 Z-ECM reflects midpoint estimate with an error margin of +/–5 percentage points.
3 Before capital deployment.